This function creates a visualization of the results of the PCA applied on a sample of QTS without returning the plot data as an object.
Arguments
- x
An object of class
prcomp_qtsas produced by theprcomp.qts_sample()method.- what
A string specifying what kind of visualization the user wants to perform. Choices are words starting with
PCand ending with a PC number (in which case the mean QTS is displayed along with its perturbations due to the required PC) orscores(in which case individuals are projected on the required plane). Defaults toPC1.- ...
If
what = "PC?", the user can specify whether to plot the QTS in the tangent space or in the original space by providing a boolean argumentoriginal_spacewhich defaults toTRUE. Ifwhat = "scores", the user can specify the plane onto which the individuals will be projected by providing a length-2 integer vector argumentplanewhich defaults to1:2.
Examples
df <- as_qts_sample(vespa64$igp[1:16])
res_pca <- prcomp(df)
#> ℹ The maximum number of principal component is 15.
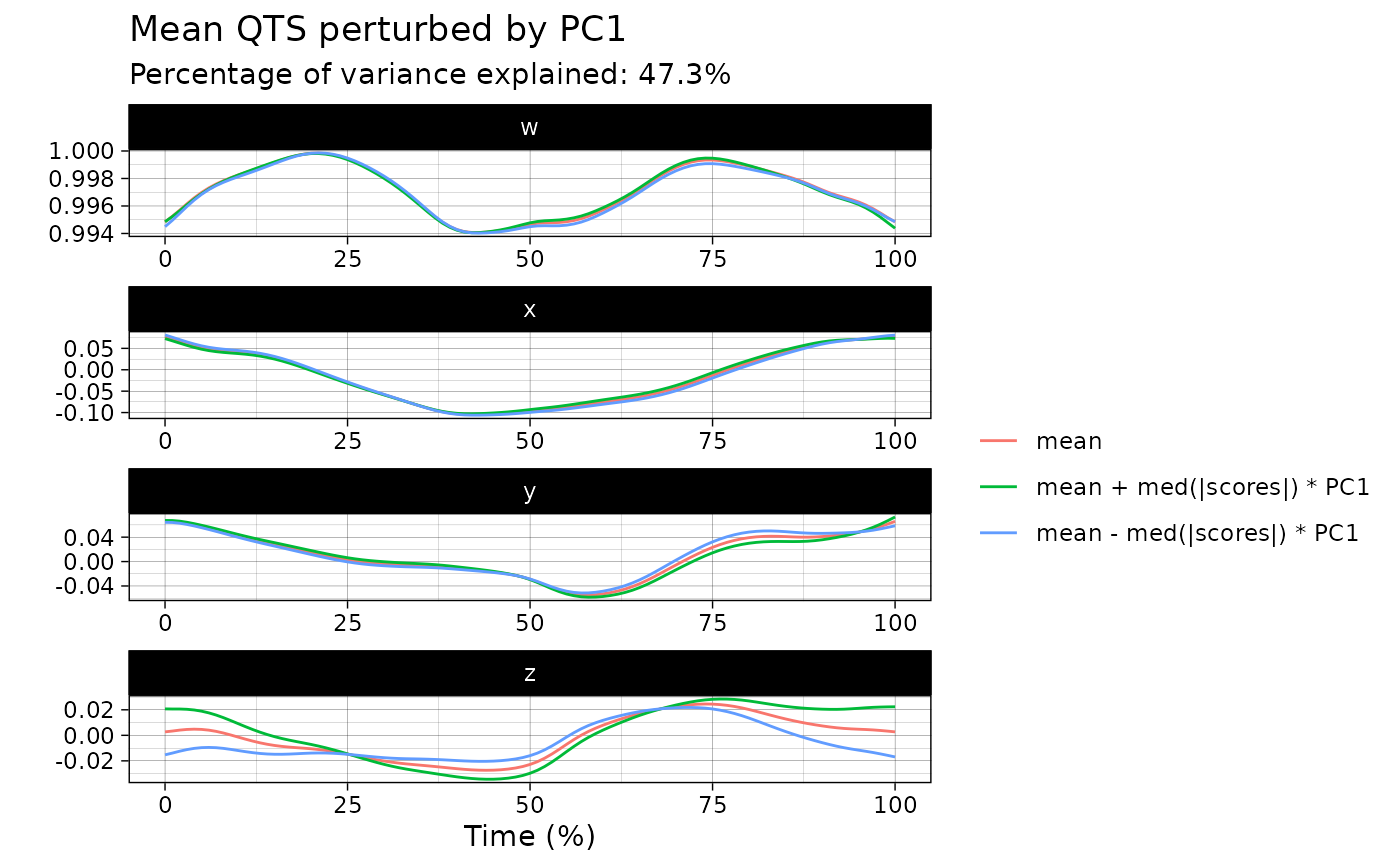
# You can plot the effect of a PC on the mean
plot(res_pca, what = "PC1")
#> The `original_space` boolean argument is not specified. Defaulting to TRUE.
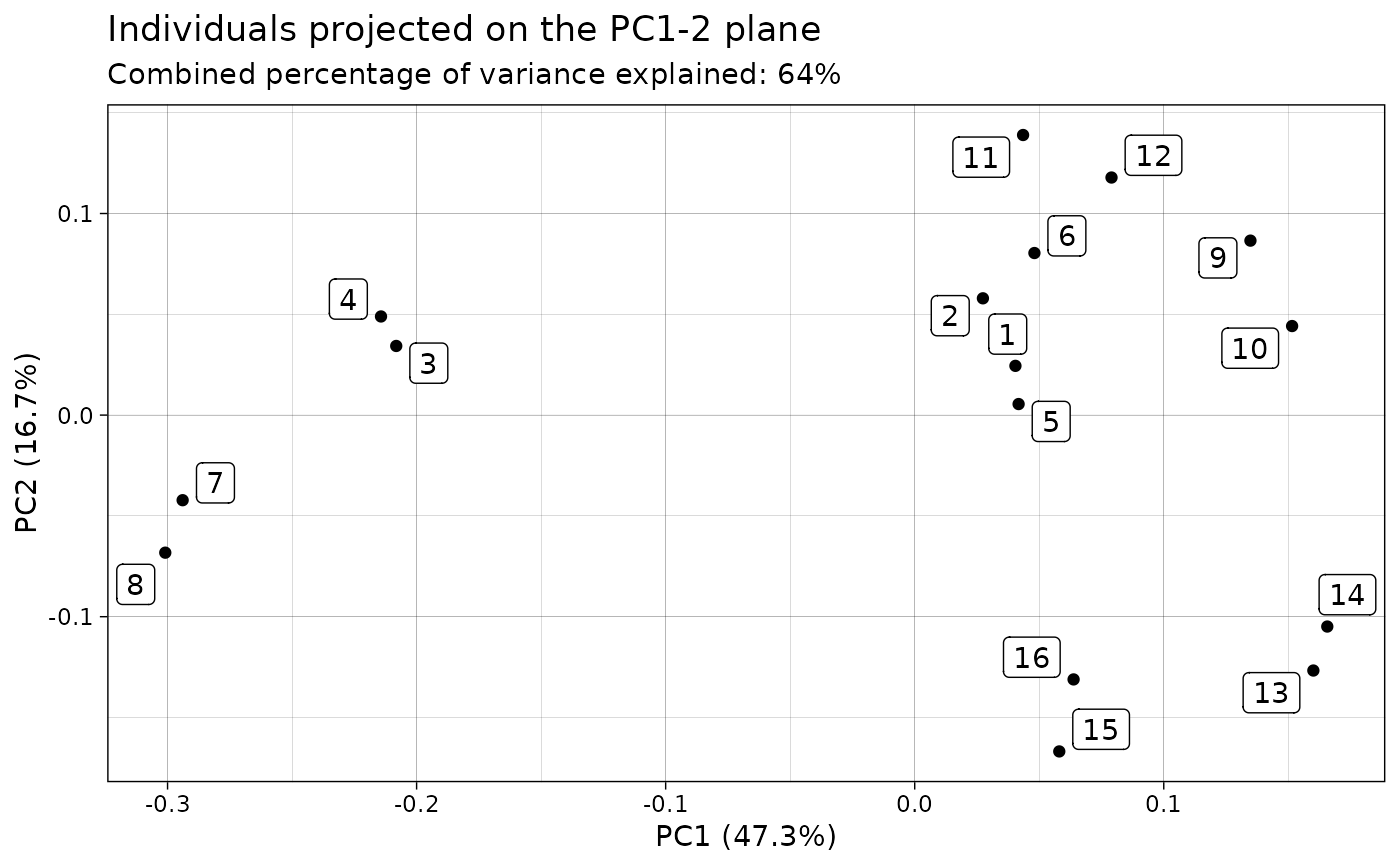
 # You can plot the data points in a PC plane
plot(res_pca, what = "scores")
#> The `plane` length-2 integer vector argument is not specified. Defaulting to
#> 1:2.
# You can plot the data points in a PC plane
plot(res_pca, what = "scores")
#> The `plane` length-2 integer vector argument is not specified. Defaulting to
#> 1:2.