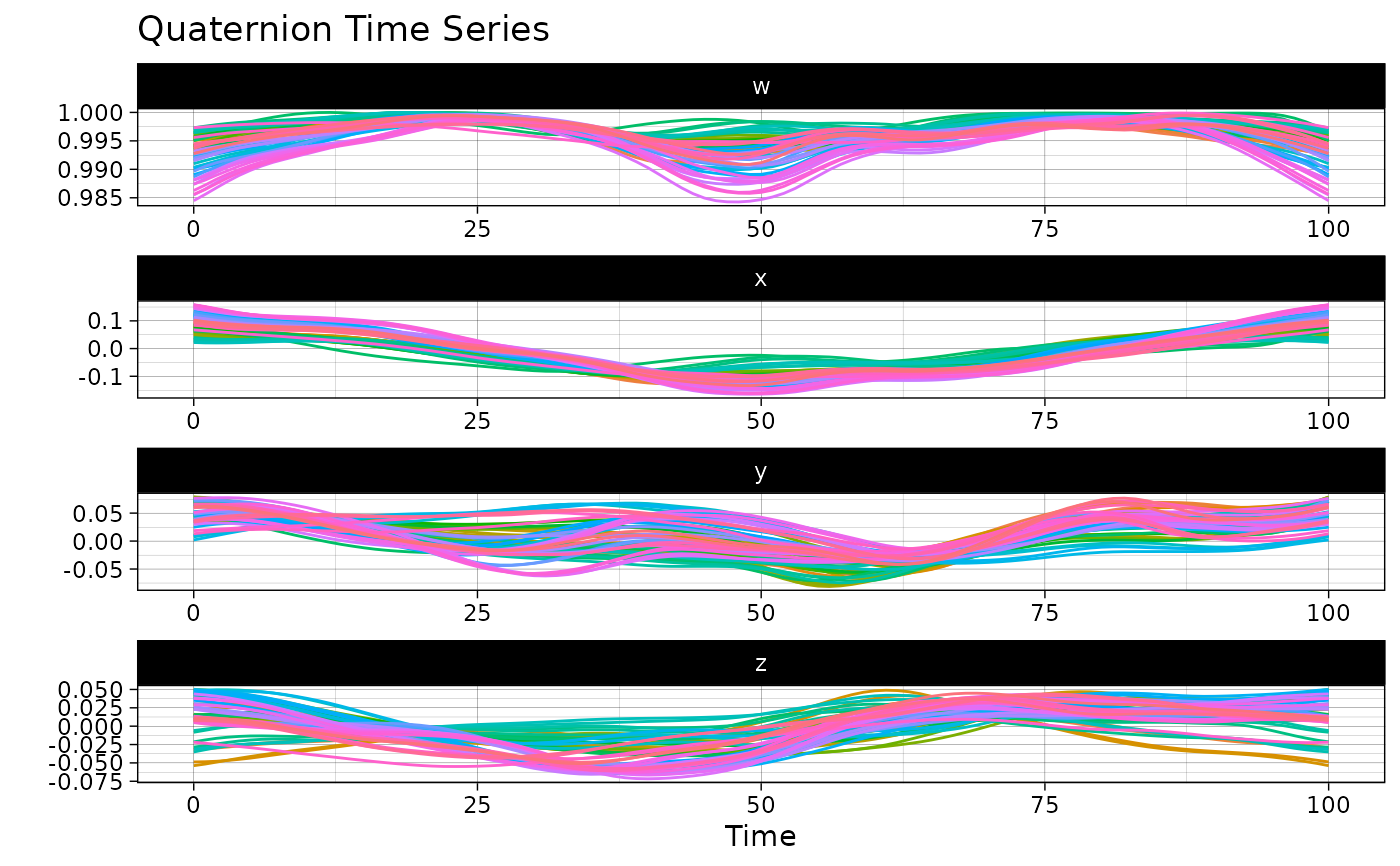
This function creates a visualization of a sample of QTS and returns the corresponding ggplot2::ggplot object which enable further customization of the plot.
Usage
# S3 method for class 'qts_sample'
autoplot(
  object,
  memberships = NULL,
  highlighted = NULL,
  with_animation = FALSE,
  ...
)
Arguments
- object
An object of class
qts_sample.- memberships
A vector coercible as factor specifying a group membership for each QTS in the sample. Defaults to
NULL, in which case no grouping structure is displayed.- highlighted
A boolean vector specifying whether each QTS in the sample should be hightlighted. Defaults to
NULL, in which case no QTS is hightlighted w.r.t. the others.- with_animation
A boolean value specifying whether to create a an animated plot or a static ggplot2::ggplot object. Defaults to
FALSEwhich will create a static plot.- ...
Further arguments to be passed to methods.
Value
A ggplot2::ggplot object.
Examples
ggplot2::autoplot(vespa64$igp)