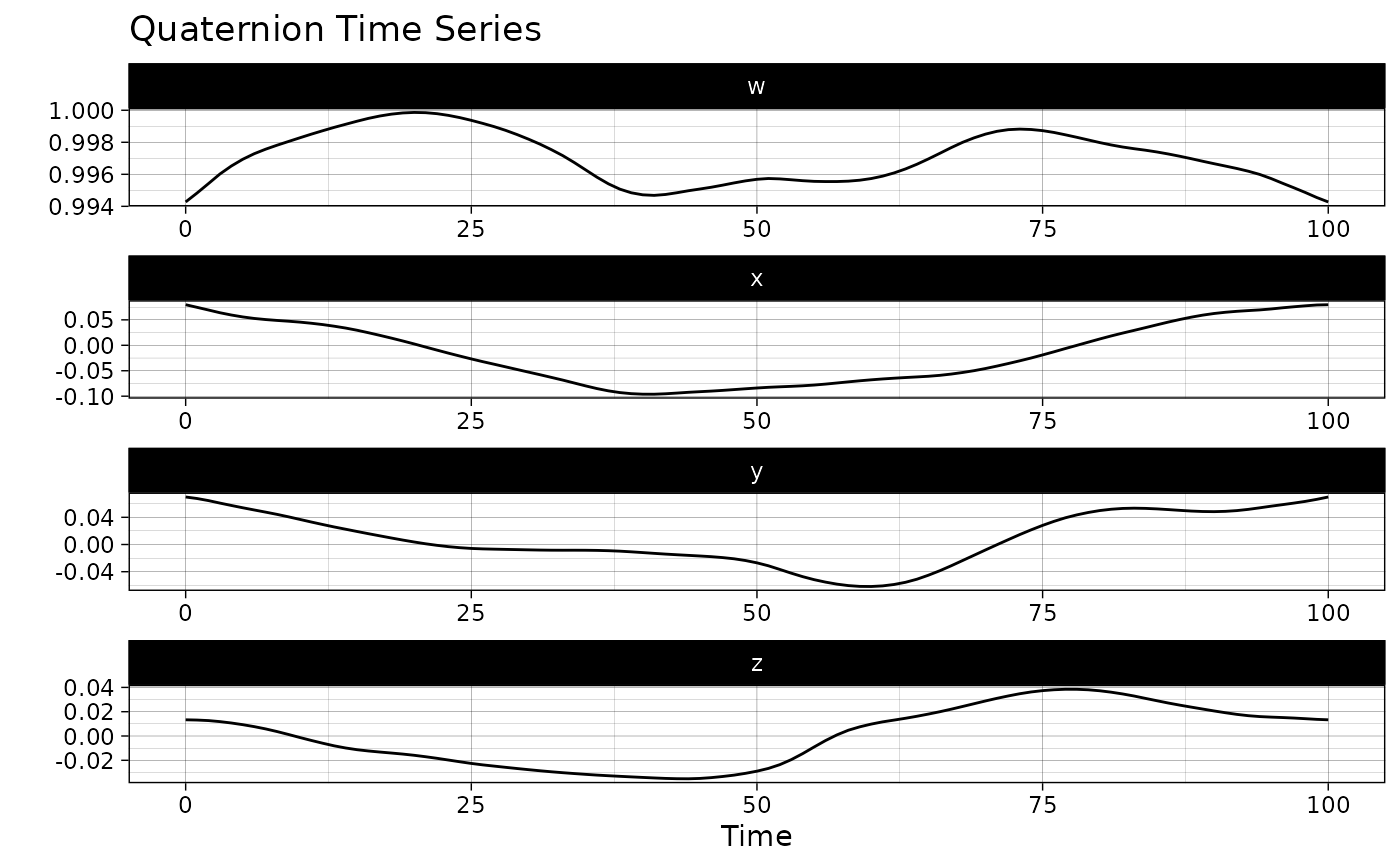
This function creates a visualization of a QTS without returning the plot data as an object.
Usage
# S3 method for class 'qts'
plot(x, highlighted_points = NULL, ...)
Arguments
- x
An object of class qts.
- highlighted_points
An integer vector specifying point indices to be highlighted. Defaults to
NULL, in which case no point will be highlighted with respect to the others.- ...
Further arguments to be passed on to next methods.
Examples
plot(vespa64$igp[[1]])