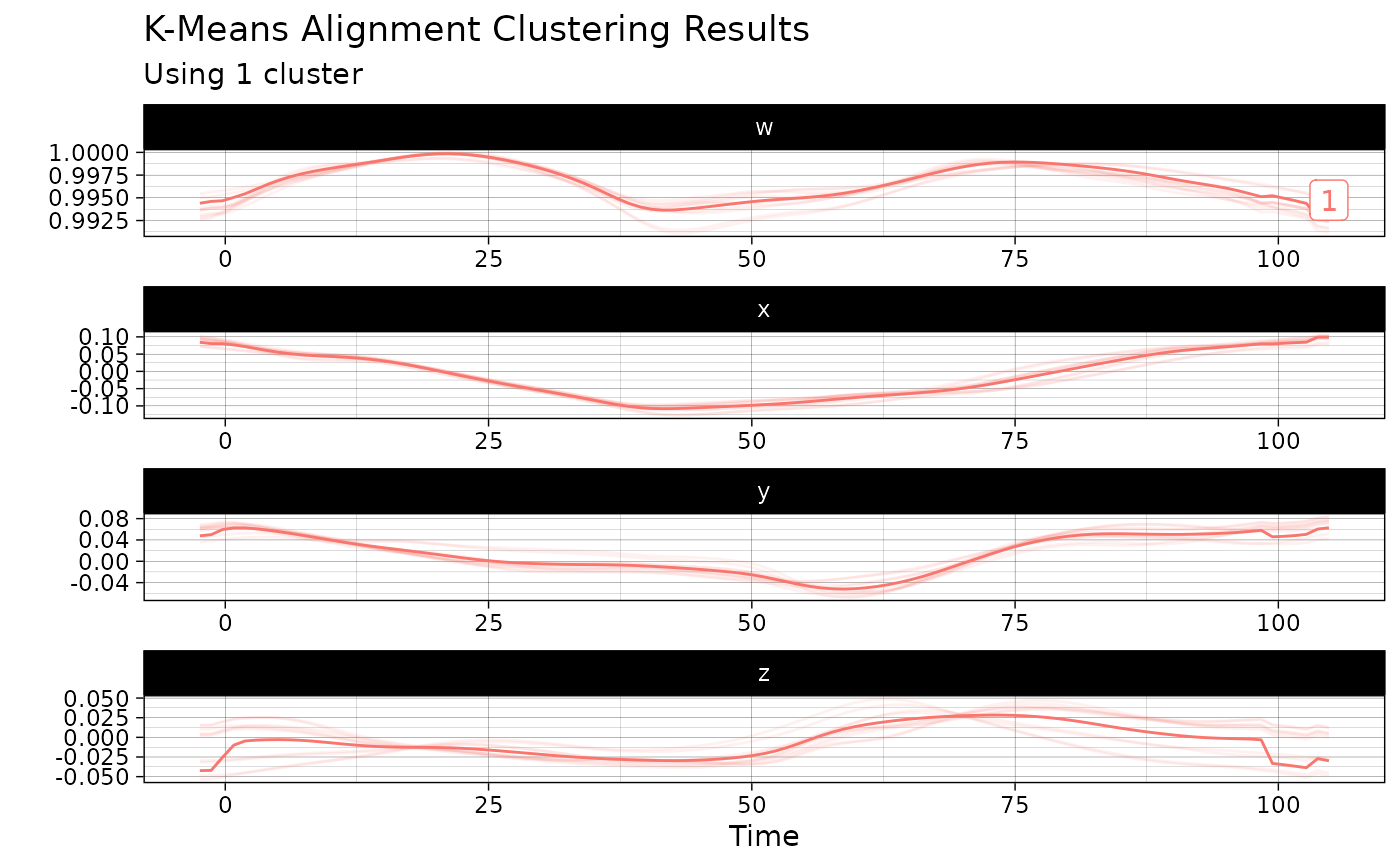
This function creates a visualization of the results of the k-means alignment algorithm applied on a sample of QTS without returning the plot data as an object.
Usage
# S3 method for kma_qts
plot(x, ...)
Arguments
- x
An object of class
kma_qtsas produced by thekmeans()function.- ...
Further arguments to be passed to other methods.
Examples
res_kma <- kmeans(vespa64$igp[1:10], k = 2, nstart = 1)
#> ℹ Computing initial centroids using kmeans++ strategy...
#> Information about the data set:
#>  - Number of observations: 10
#>  - Number of dimensions: 3
#>  - Number of points: 101
#>
#> Information about cluster initialization:
#>  - Number of clusters: 1
#>  - Initial seeds for cluster centers:         9
#>
#> Information about the methods used within the algorithm:
#>  - Warping method: affine
#>  - Center method: mean
#>  - Dissimilarity method: l2
#>  - Optimization method: bobyqa
#>
#> Information about warping parameter bounds:
#>  - Warping options:    0.1500   0.1500
#>
#> Information about convergence criteria:
#>  - Maximum number of iterations: 100
#>  - Distance relative tolerance: 0.001
#>
#> Information about parallelization setup:
#>  - Number of threads: 1
#>  - Parallel method: 0
#>
#> Other information:
#>  - Use fence to robustify: 0
#>  - Check total dissimilarity: 1
#>  - Compute overall center: 0
#>
#> Running k-centroid algorithm:
#>  - Iteration #1
#>    * Size of cluster #0: 10
#>  - Iteration #2
#>    * Size of cluster #0: 10
#>  - Iteration #3
#>    * Size of cluster #0: 10
#>  - Iteration #4
#>    * Size of cluster #0: 10
#>  - Iteration #5
#>    * Size of cluster #0: 10
#>  - Iteration #6
#>    * Size of cluster #0: 10
#>
#> Active stopping criteria:
#>  - The total dissimilarity did not decrease.
plot(res_kma)