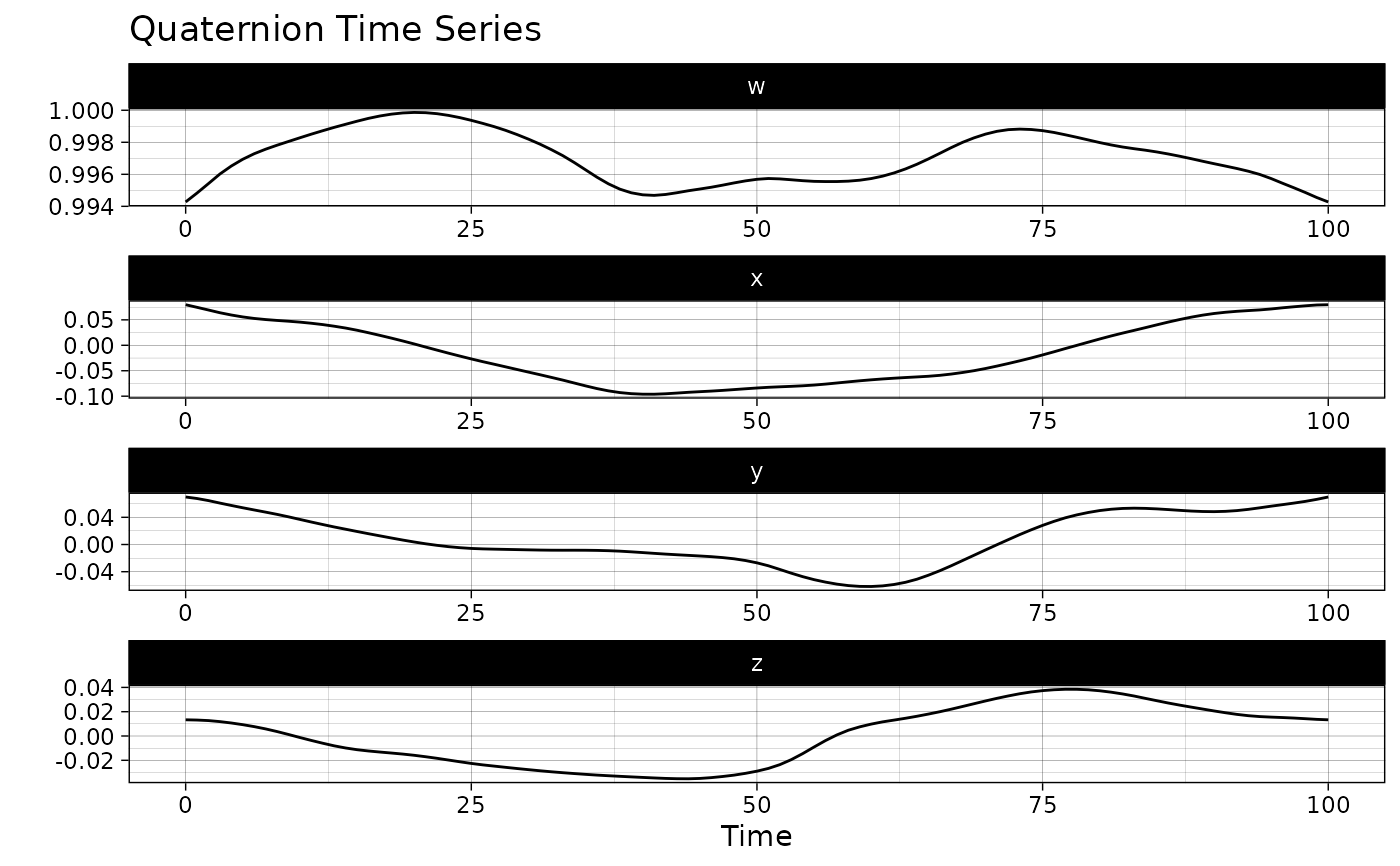
This function creates a visualization of a QTS and returns the corresponding ggplot2::ggplot object which enable further customization of the plot.
Arguments
- object
An object of class qts.
- highlighted_points
An integer vector specifying point indices to be highlighted. Defaults to
NULL, in which case no point will be highlighted with respect to the others.- ...
Further arguments to be passed on to next methods.
Value
A ggplot2::ggplot object.
Examples
ggplot2::autoplot(vespa64$igp[[1]])