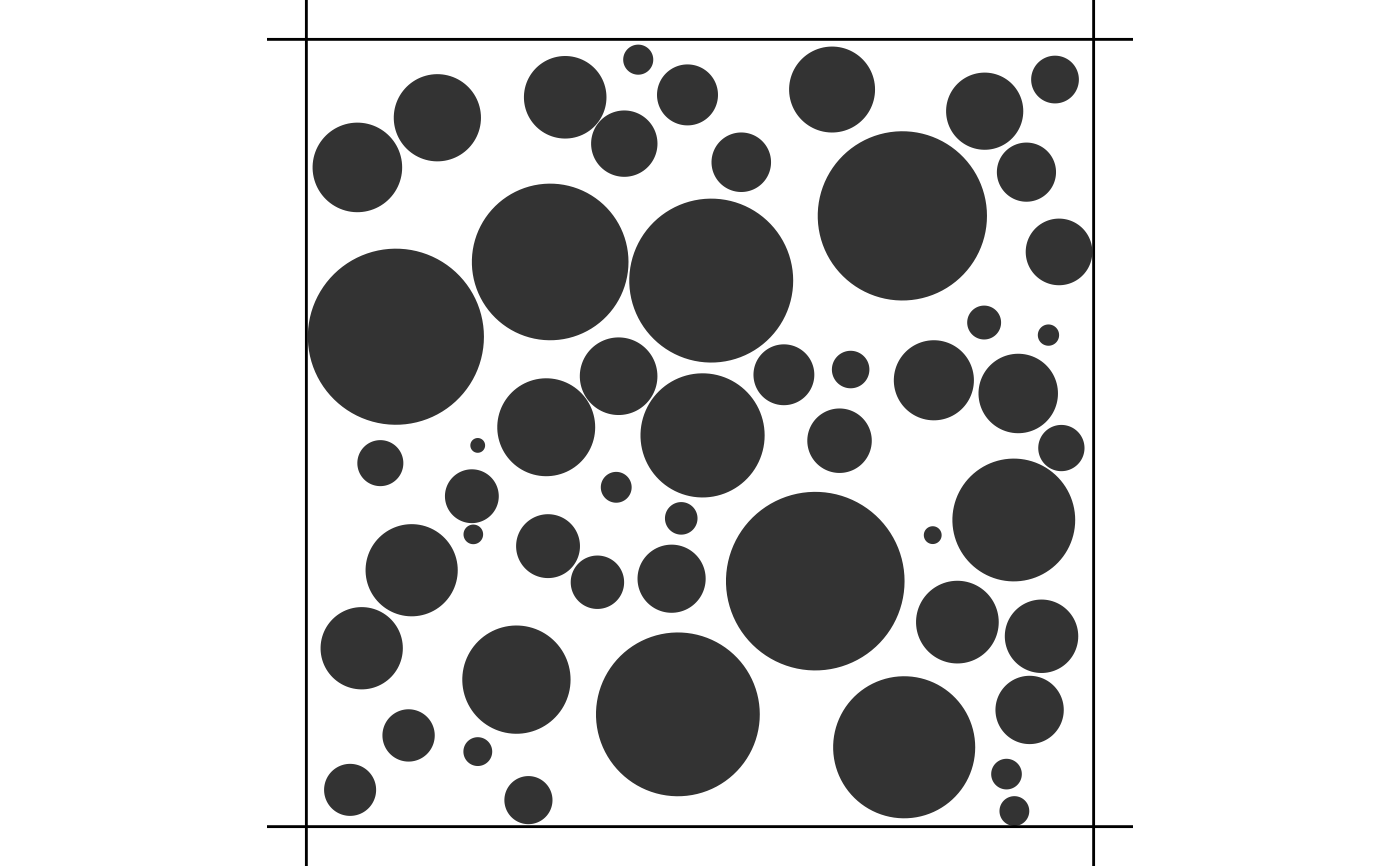
Plots a cross section of a cylinder bundle
Usage
# S3 method for class 'bundle'
plot(x, grid_size = 100L, ...)
Arguments
- x
An object of class
bundleas generated bysimulate_bundle().- grid_size
An integer value specifying the number of points on which the unit circle should be discretized to draw the spheres. Defaults to
100L.- ...
Additional arguments to be passed to the
ggplot2::autoplot()method.
Examples
density <- 0.5
voxel_size <- 5 # micrometers
withr::with_seed(1234, {
  out <- simulate_bundle(density, voxel_size)
})
plot(out)
