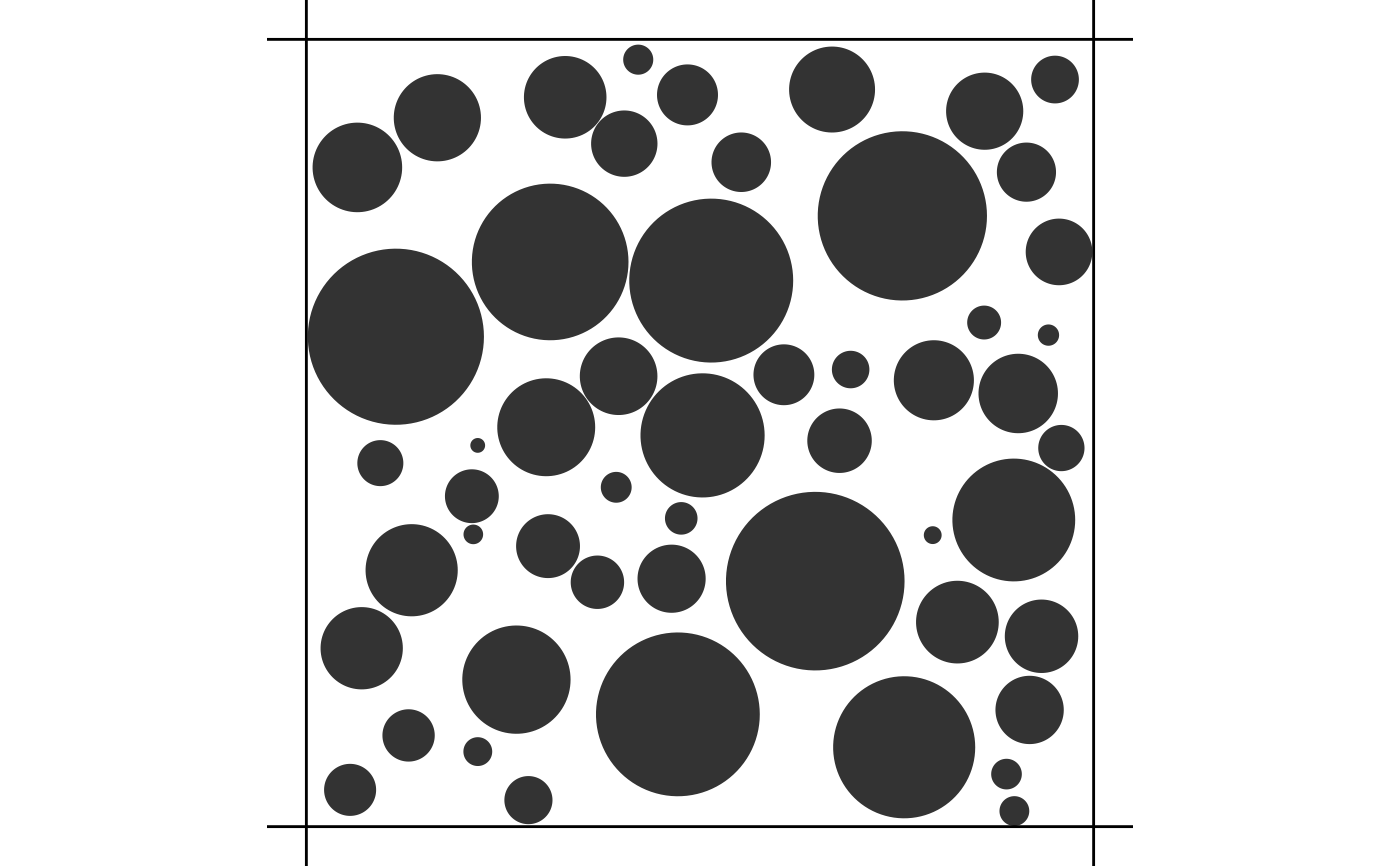
Plots a cross section of a cylinder bundle using ggplot2
Source:R/cylinder-bundle-geometry.R
autoplot.bundle.RdPlots a cross section of a cylinder bundle from an object of class bundle
as generated by simulate_bundle() using
ggplot2.
Arguments
- object
An object of class
bundleas generated bysimulate_bundle().- grid_size
An integer value specifying the number of points on which the unit circle should be discretized to draw the spheres. Defaults to
100L.- ...
Additional arguments to be passed to the
ggplot2::autoplot()method.
Value
A ggplot2::ggplot() object.
Examples
density <- 0.5
voxel_size <- 5 # micrometers
withr::with_seed(1234, {
  out <- simulate_bundle(density, voxel_size)
})
ggplot2::autoplot(out)
