[1]:
import math
import pandas as pd
from tqdm import tqdm
import numpy as np
from kaov import AOV
from matplotlib import pyplot as plt
import sys
import scanpy as sc
sys.setrecursionlimit(10000)
kAOV & Scanpy#
Importing data#
Malonga et al., 2025
[13]:
# Download the file from URL:
# url = "https://raw.githubusercontent.com/LMJL-Alea/kAOV/refs/heads/main/Data/rabbits_ct.h5ad"
adata = sc.read_h5ad('Data/rabbits_ct.h5ad')
Scanpy & AnnData#
[129]:
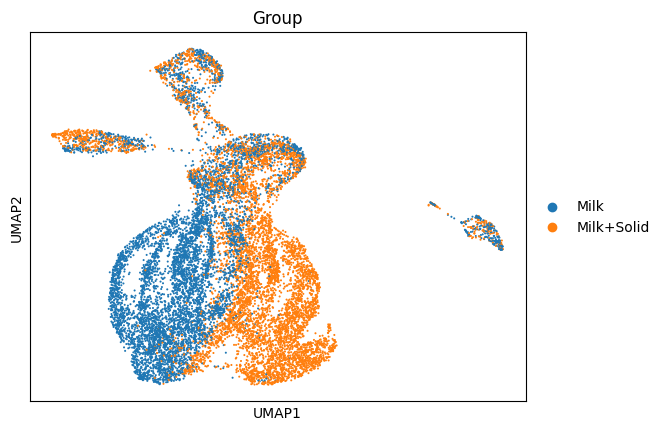
sc.pl.umap(adata, color='Group')
[51]:
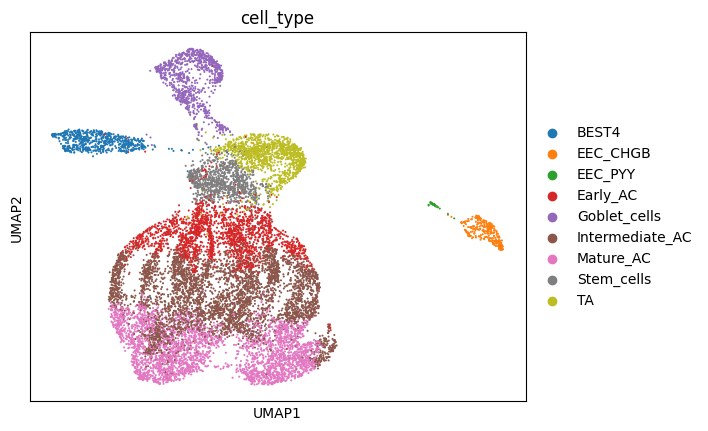
sc.pl.umap(adata, color='cell_type')
kAOV#
[52]:
data = pd.DataFrame(data=adata._X, columns=adata._var.index, index=adata._obs.index)
meta_cols = ['Group', 'cell_type', 'Litter']
meta = adata._obs[['Group', 'cell_type', 'Litter']]
[54]:
data_merged = data.join(meta)
[111]:
gene_cols = data_merged.columns.difference(meta_cols)
formula = 'C(Group, OneHot) * C(cell_type, OneHot) + C(Litter, OneHot)'
[112]:
form_exog = " + ".join([f'Q("{g}")' for g in gene_cols])
formula = form_exog + ' ~ C(Group, OneHot) * C(cell_type, OneHot) + C(Litter, OneHot)'
rnd_gen = np.random.default_rng(1)
kfit = AOV.from_formula(formula, data = data_merged, nystrom = True, random_gen=rnd_gen)
res = kfit.test(hypotheses = "pairwise", hypotheses_subset=['Group:cell_type',], verbose=1)
-Computing the Gram matrix...
-Testing hypotheses:
100%|████████████████████████████████████████████| 1/1 [02:36<00:00, 156.13s/it]
UMAP-like plots of embedding projections#
[113]:
proj_umap_like = np.vstack([res.projections['Group:cell_type'][1].values,
                            res.projections['Group:cell_type'][2].values]).T
[114]:
proj_umap_like
[114]:
array([[-0.01315351, -0.09613174],
       [ 0.14918402, -0.19288621],
       [-0.0989323 ,  0.0337157 ],
       ...,
       [-0.10294646,  0.08425173],
       [-0.02143752, -0.07003955],
       [-0.07849434,  0.13906476]])
[115]:
adata_proj = adata.copy()
adata_proj.obsm['X_umap'] = proj_umap_like
[116]:
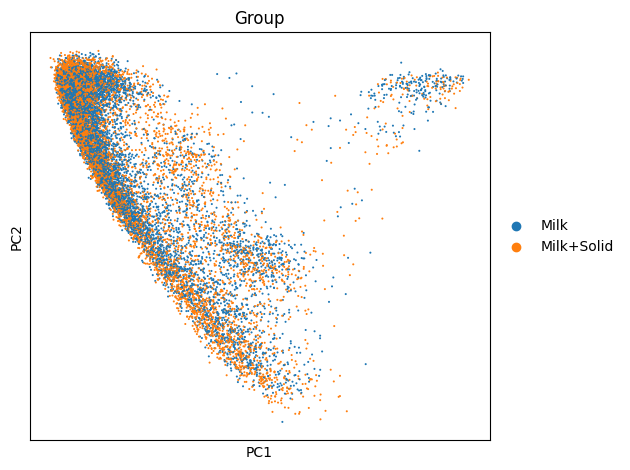
axs = sc.pl.umap(adata_proj, color='Group', show=False)
axs.set_xlabel('PC1')
axs.set_ylabel('PC2')
plt.tight_layout()
plt.show()
[117]:
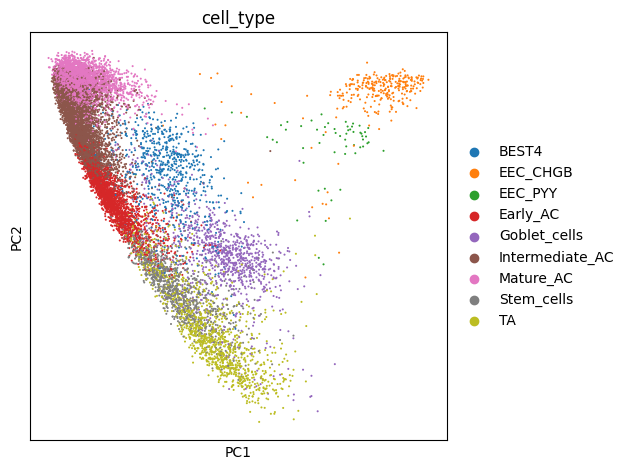
axs = sc.pl.umap(adata_proj, color='cell_type', show=False)
axs.set_xlabel('PC1')
axs.set_ylabel('PC2')
plt.tight_layout()
plt.show()
[67]:
### kAOV: genewise analysis
rnd_gen = np.random.default_rng(1)
[64]:
import warnings
warnings.filterwarnings("ignore")
[127]:
# Exctracting CD14+ monocytes:
ct = 'Mature_AC'
data_merged_ct = data_merged[data_merged['cell_type'] == ct]
[75]:
pval_df = pd.DataFrame(columns=gene_cols)
stat_df = pd.DataFrame(columns=gene_cols)
formula = 'C(Group, OneHot) + C(Litter, OneHot)'

it = tqdm(gene_cols)
#it = tqdm(gene_cols[:10])
for i, g in enumerate(it):
    data_g = data_merged_ct[[g, ] + ['Group', 'Litter']]
    kfit_g = AOV.from_formula(f'Q("{g}")' + ' ~ ' + formula, data=data_g,
                              nystrom=True, n_landmarks=1000, random_gen=rnd_gen)
    res_g = kfit_g.test(hypotheses_subset=['Group',], skip_projections_and_cook=True, verbose=0)
    pval_df[g] = res_g.stats['Group']['pval']
    stat_df[g] = res_g.stats['Group']['stat']
100%|███████████████████████████████████████| 2000/2000 [13:21<00:00, 2.49it/s]
[76]:
# Correct p-values with respect to genes and cell types:
pval_corr_df = (pval_df * pval_df.shape[1]).clip(upper=1)
[109]:
stat_df.to_csv(filepath + 'rabbits_genewise_stat.csv')
pval_df.to_csv(filepath + 'rabbits_genewise_pval.csv')
Genewise analysis#
Get the list of top 20 marker genes:
[77]:
t1 = 1
top_genes_ct = list(stat_df.loc[t1].sort_values()[-20:][::-1].index)
[103]:
adata_ct = adata[adata.obs["cell_type"].str.contains("Mature")].copy()
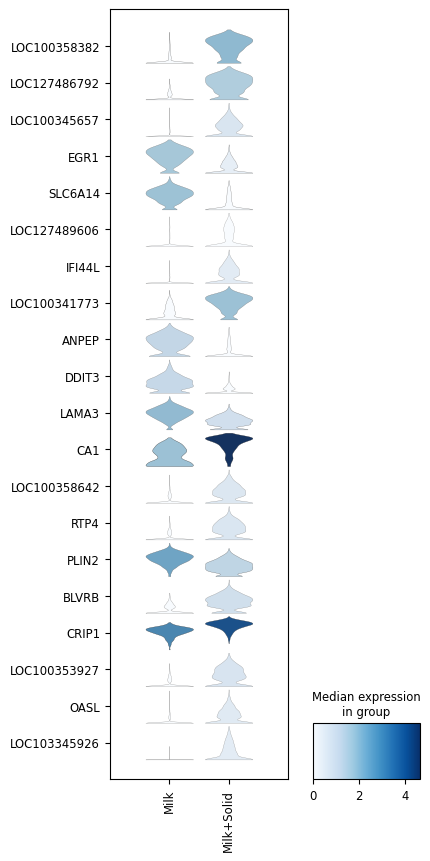
Violin plots:
[104]:
sc.pl.stacked_violin(adata_ct, var_names=top_genes_ct, groupby="Group", swap_axes=True, figsize=(4, 10))
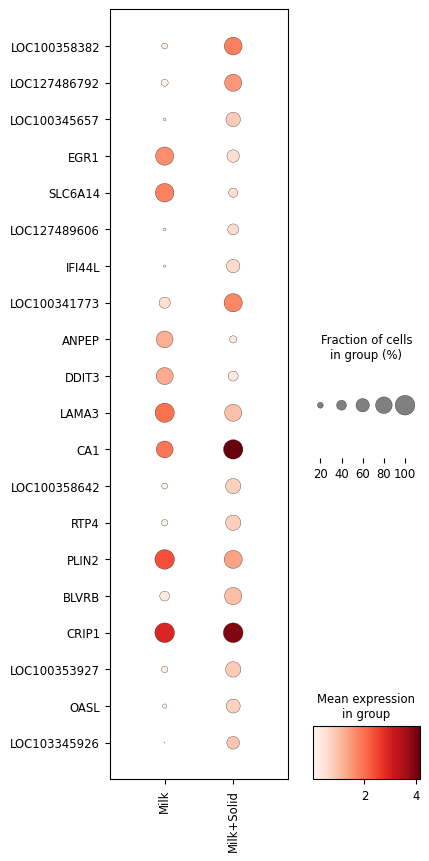
Dotplots:
[88]:
sc.pl.dotplot(adata_ct, var_names=top_genes_ct, groupby="Group", use_raw=True,
              swap_axes=True, figsize=(4, 10),
             )
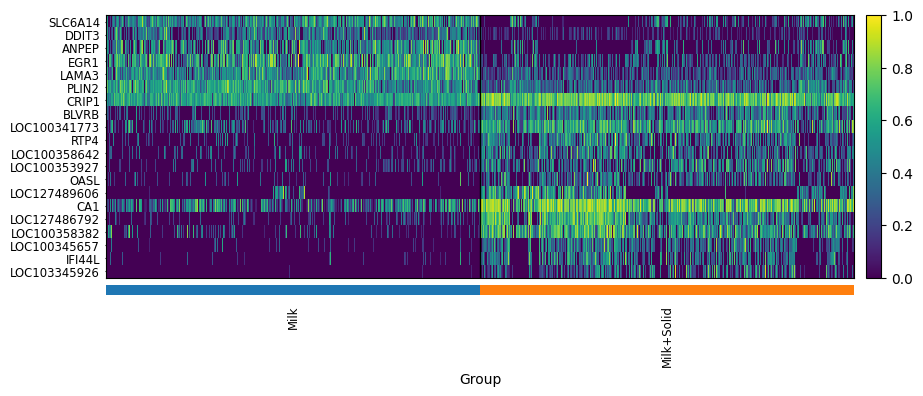
Heatmaps:
[92]:
sc.tl.rank_genes_groups(adata_ct, groupby="Group", groups=["Milk+Solid"], reference="Milk")
df_logfc = (sc.get.rank_genes_groups_df(adata_ct, group="Milk+Solid")[["names", "logfoldchanges"]]
            .rename(columns={"names": "gene"}).set_index('gene'))
[107]:
sc.pl.heatmap(adata_ct, groupby="Group",
              var_names=df_logfc.loc[top_genes_ct].sort_values(by='logfoldchanges').index,
              swap_axes=True, show_gene_labels=True,
              standard_scale='var',
             )
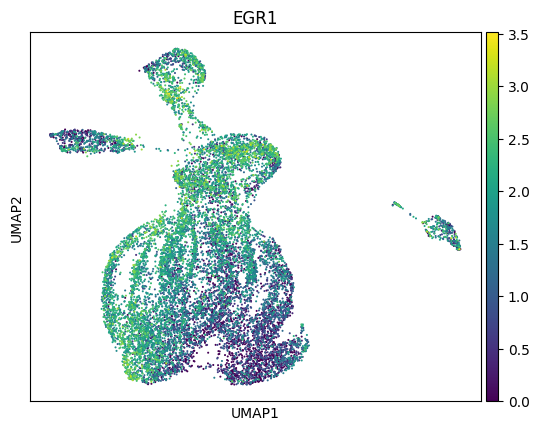
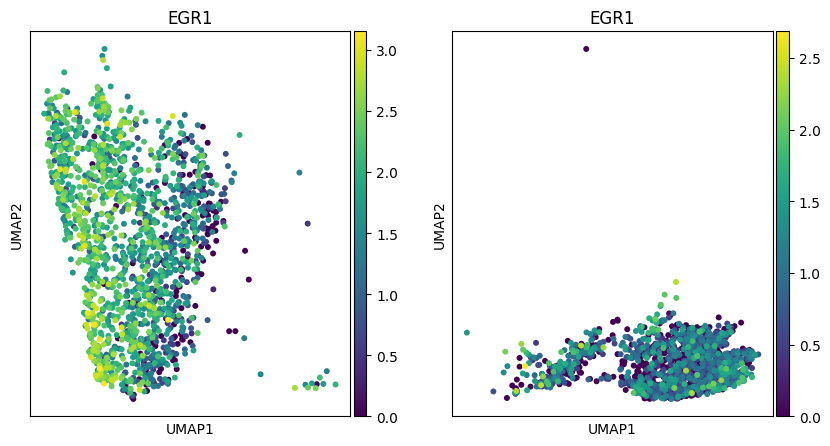
Gene expression on UMAP:
[119]:
g = top_genes_ct[3]
sc.pl.umap(adata, color=g)
fig, axs = plt.subplots(1, 2, figsize=(10, 5))
sc.pl.umap(adata[(adata.obs["cell_type"] == ct)&(adata.obs["Group"]=='Milk')].copy(),
           color=g, ax=axs[0], show=False)
sc.pl.umap(adata[(adata.obs["cell_type"] == ct)&(adata.obs["Group"]=='Milk+Solid')].copy(),
           color=g, ax=axs[1])
plt.show()
[121]:
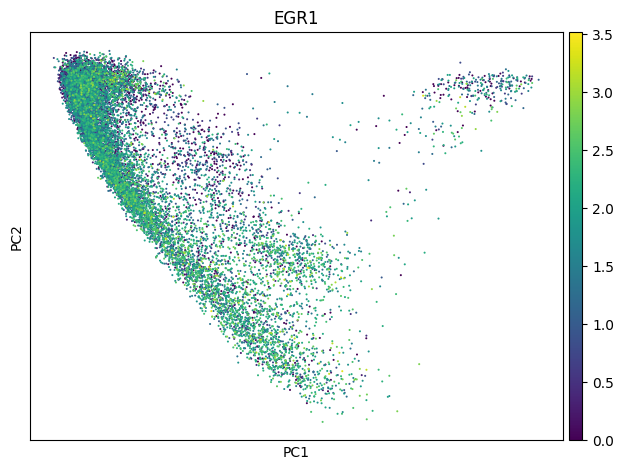
axs = sc.pl.umap(adata_proj, color=g, show=False)
axs.set_xlabel('PC1')
axs.set_ylabel('PC2')
plt.tight_layout()
plt.show()

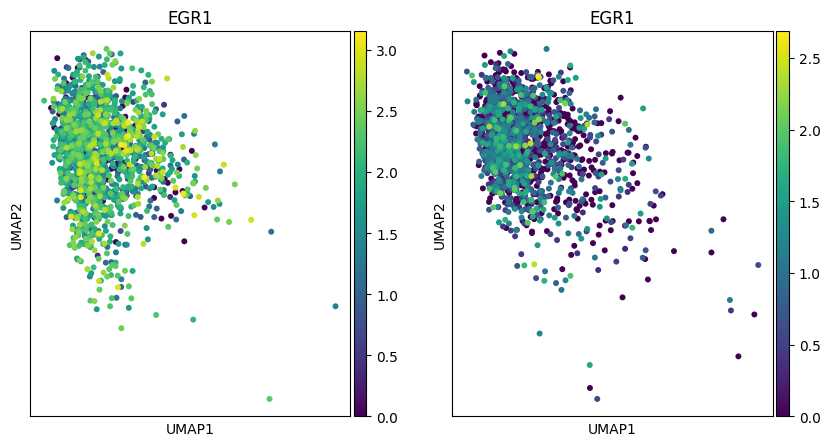
fig, axs = plt.subplots(1, 2, figsize=(10, 5))
sc.pl.umap(adata_proj[(adata_proj.obs["cell_type"] == ct)&(adata_proj.obs["Group"]=='Milk')].copy(),
           color=g, ax=axs[0], show=False)
sc.pl.umap(adata_proj[(adata_proj.obs["cell_type"] == ct)&(adata_proj.obs["Group"]=='Milk+Solid')].copy(),
           color=g, ax=axs[1])
plt.tight_layout()
plt.show()
<Figure size 640x480 with 0 Axes>
Cook’s distances#
Distances:#
[123]:
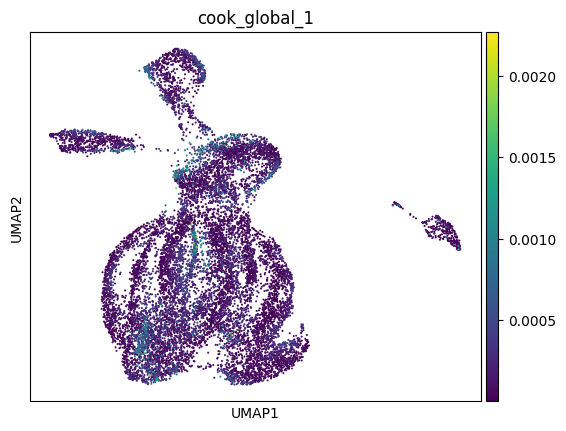
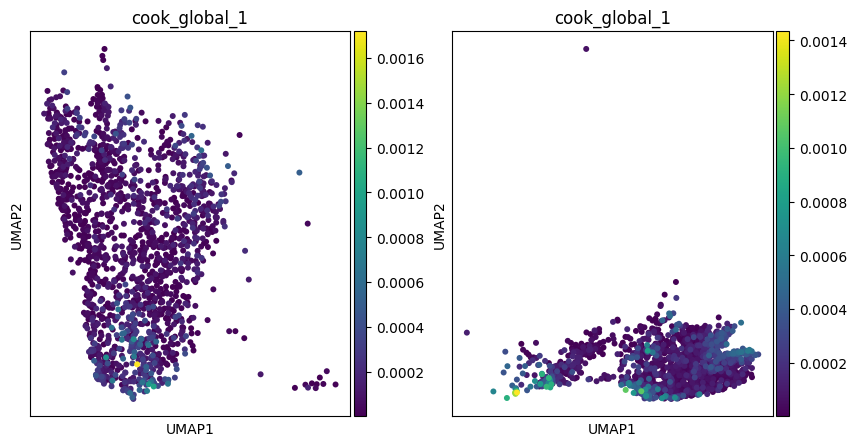
adata.obs["cook_global_1"] = res.cook_distances['Group:cell_type'][1]
adata.obs["cook_global_2"] = res.cook_distances['Group:cell_type'][2]
[124]:
cook_name = "cook_global_1"
sc.pl.umap(adata, color=cook_name)
fig, axs = plt.subplots(1, 2, figsize=(10, 5))
sc.pl.umap(adata[(adata.obs["cell_type"] == ct)&(adata.obs["Group"]=='Milk')].copy(),
           color=cook_name, ax=axs[0], show=False)
sc.pl.umap(adata[(adata.obs["cell_type"] == ct)&(adata.obs["Group"]=='Milk+Solid')].copy(),
           color=cook_name, ax=axs[1])
plt.show()
[134]:
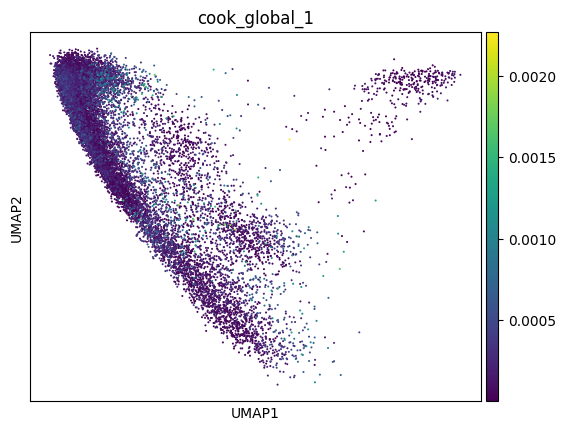
adata_proj.obs["cook_global_1"] = res.cook_distances['Group:cell_type'][1]
adata_proj.obs["cook_global_2"] = res.cook_distances['Group:cell_type'][2]
[135]:
cook_name = "cook_global_1"
sc.pl.umap(adata_proj, color=cook_name)
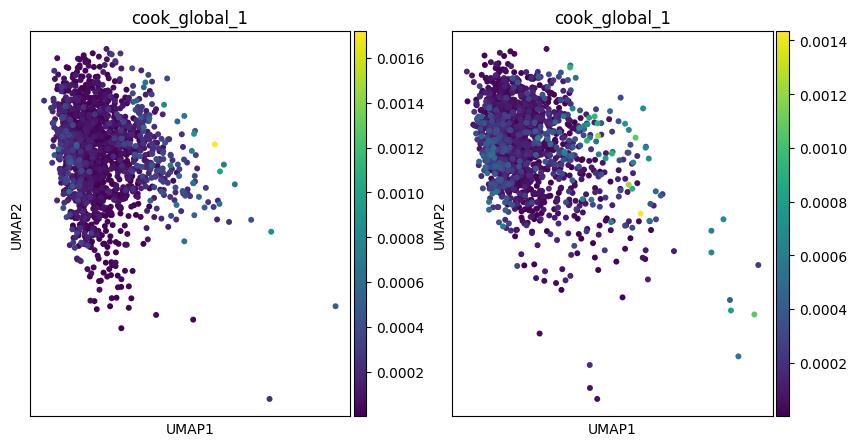
fig, axs = plt.subplots(1, 2, figsize=(10, 5))
sc.pl.umap(adata_proj[(adata_proj.obs["cell_type"] == ct)&(adata_proj.obs["Group"]=='Milk')].copy(),
           color=cook_name, ax=axs[0], show=False)
sc.pl.umap(adata_proj[(adata_proj.obs["cell_type"] == ct)&(adata_proj.obs["Group"]=='Milk+Solid')].copy(),
           color=cook_name, ax=axs[1])
plt.show()
P-values:#
[125]:
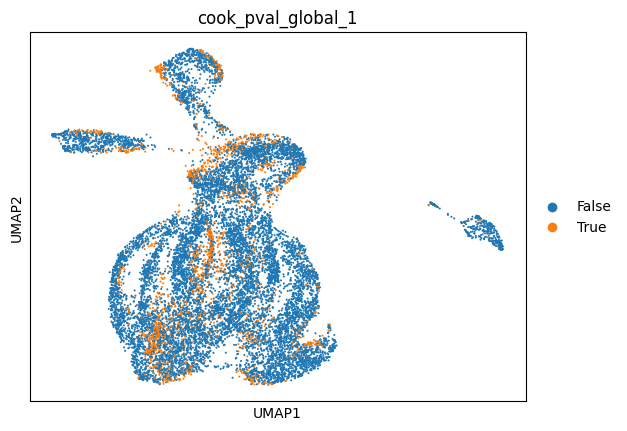
adata.obs["cook_pval_global_1"] = res.cook_pvalues['Group:cell_type'][1] < 0.05
adata.obs["cook_pval_global_2"] = res.cook_pvalues['Group:cell_type'][2] < 0.05
[128]:
cook_name = "cook_pval_global_1"
sc.pl.umap(adata, color=cook_name)
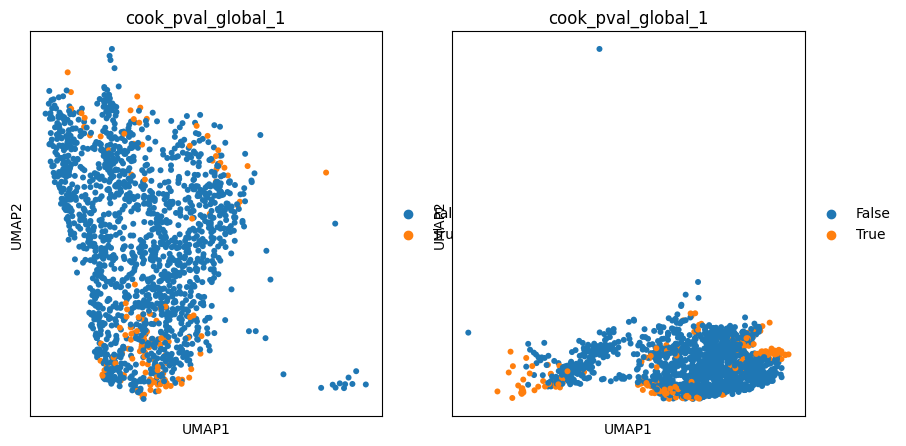
fig, axs = plt.subplots(1, 2, figsize=(10, 5))
sc.pl.umap(adata[(adata.obs["cell_type"] == ct)&(adata.obs["Group"]=='Milk')].copy(),
           color=cook_name, ax=axs[0], show=False)
sc.pl.umap(adata[(adata.obs["cell_type"] == ct)&(adata.obs["Group"]=='Milk+Solid')].copy(),
           color=cook_name, ax=axs[1])
plt.show()
[132]:
adata_proj.obs["cook_pval_global_1"] = res.cook_pvalues['Group:cell_type'][1] < 0.05
adata_proj.obs["cook_pval_global_2"] = res.cook_pvalues['Group:cell_type'][2] < 0.05
[133]:
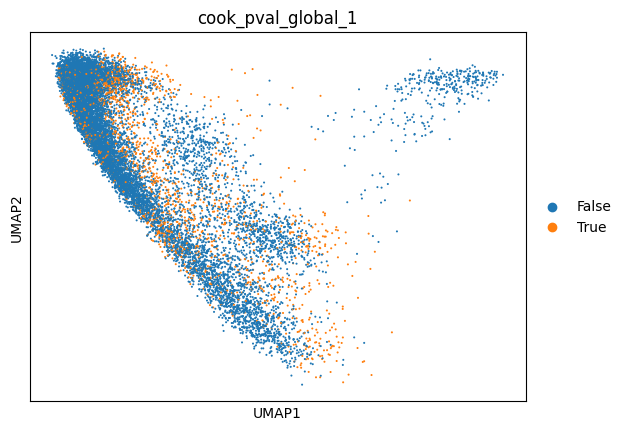
cook_name = "cook_pval_global_1"
sc.pl.umap(adata_proj, color=cook_name)
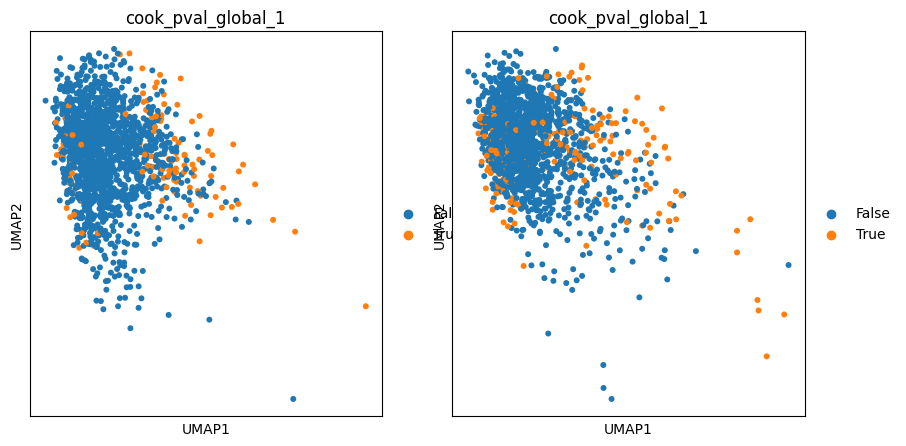
fig, axs = plt.subplots(1, 2, figsize=(10, 5))
sc.pl.umap(adata_proj[(adata_proj.obs["cell_type"] == ct)&(adata_proj.obs["Group"]=='Milk')].copy(),
           color=cook_name, ax=axs[0], show=False)
sc.pl.umap(adata_proj[(adata_proj.obs["cell_type"] == ct)&(adata_proj.obs["Group"]=='Milk+Solid')].copy(),
           color=cook_name, ax=axs[1])
plt.show()
References:#
Malonga, T., Knudsen, C., Lhuillier, É., Aymard, P., Jones, E., Lencina, C., Despeyroux, M., Riant, É., Cabau, C., Ivy, A., Loving, C. L., Vialaneix, N., & Beaumont, M. (2025). A single-cell atlas of transcriptome changes in the intestinal epithelium at the suckling-to-weaning transition. Cellular and Molecular Gastroenterology and Hepatology, 20(1), 101628.
[ ]: